Profiling Web Applications
Profiling is an essential tool for identifying performance bottlenecks in your
TurboGears application. TurboGears provides built-in profiling capabilities through
the tgext.debugbar extension, which is automatically enabled in development mode.
Enabling the Debugbar
The debugbar is enabled by default in quickstarted TurboGears projects when running
in development mode. When you start your application with gearbox serve, the
debugbar automatically appears at the bottom of each page.
If you need to manually enable it, ensure tgext.debugbar is in your project’s
requirements and that the middleware is configured in your application setup.
The Debugbar Interface
Once enabled, the debugbar provides several tabs with profiling information:
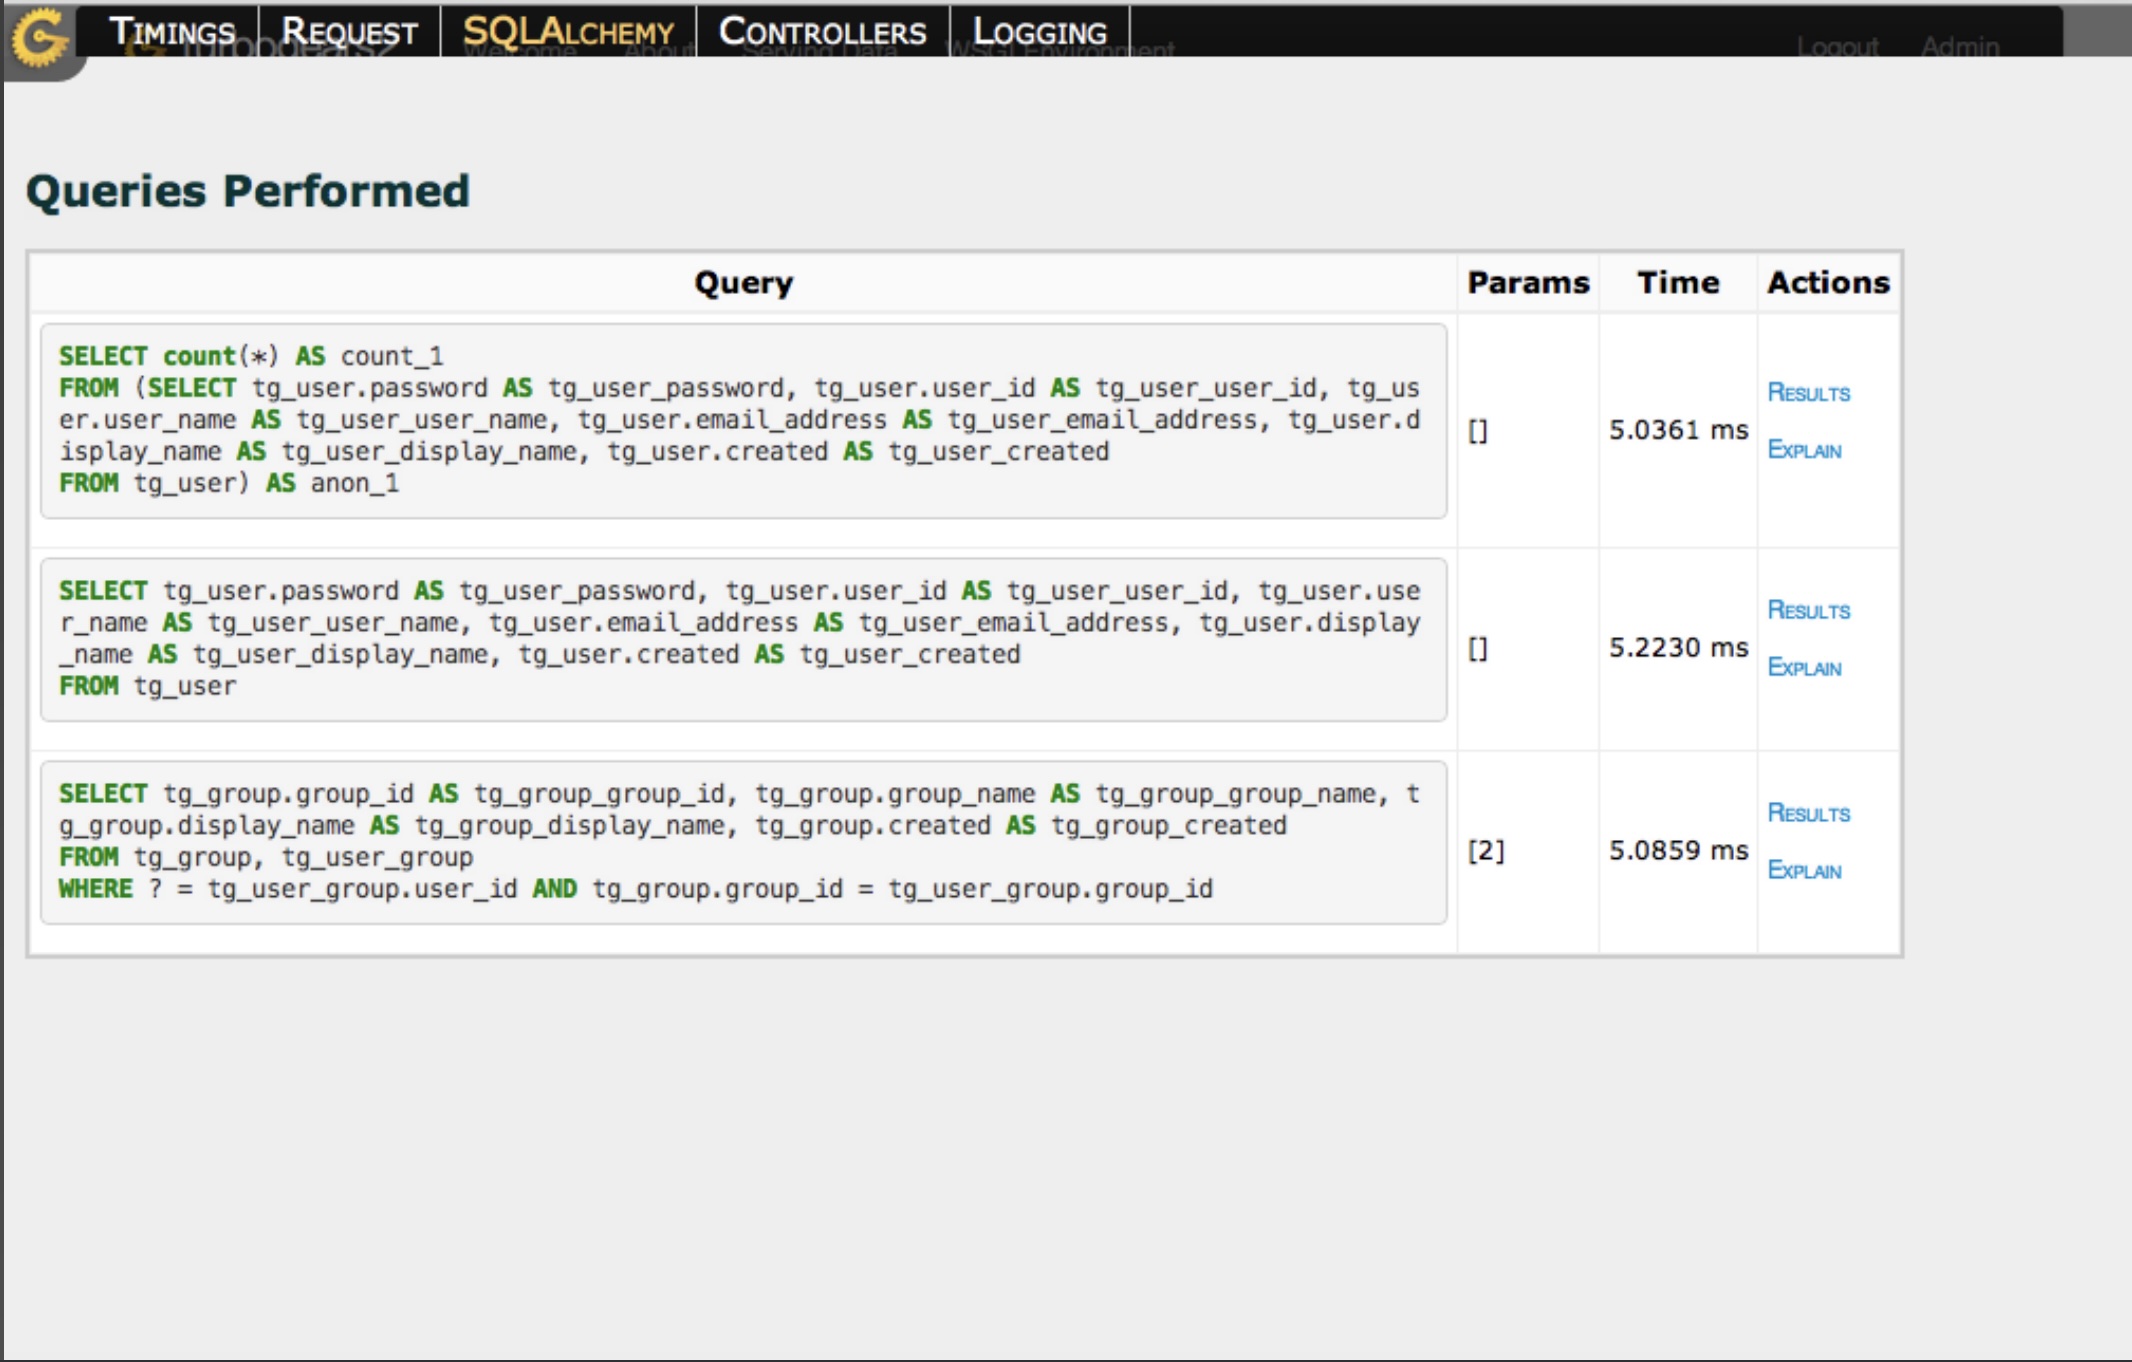
SQL Queries
The SQL tab shows all database queries executed during the request, including:
The SQL statement
Execution time
Parameters used
Number of rows returned
This helps identify slow queries or N+1 query problems.
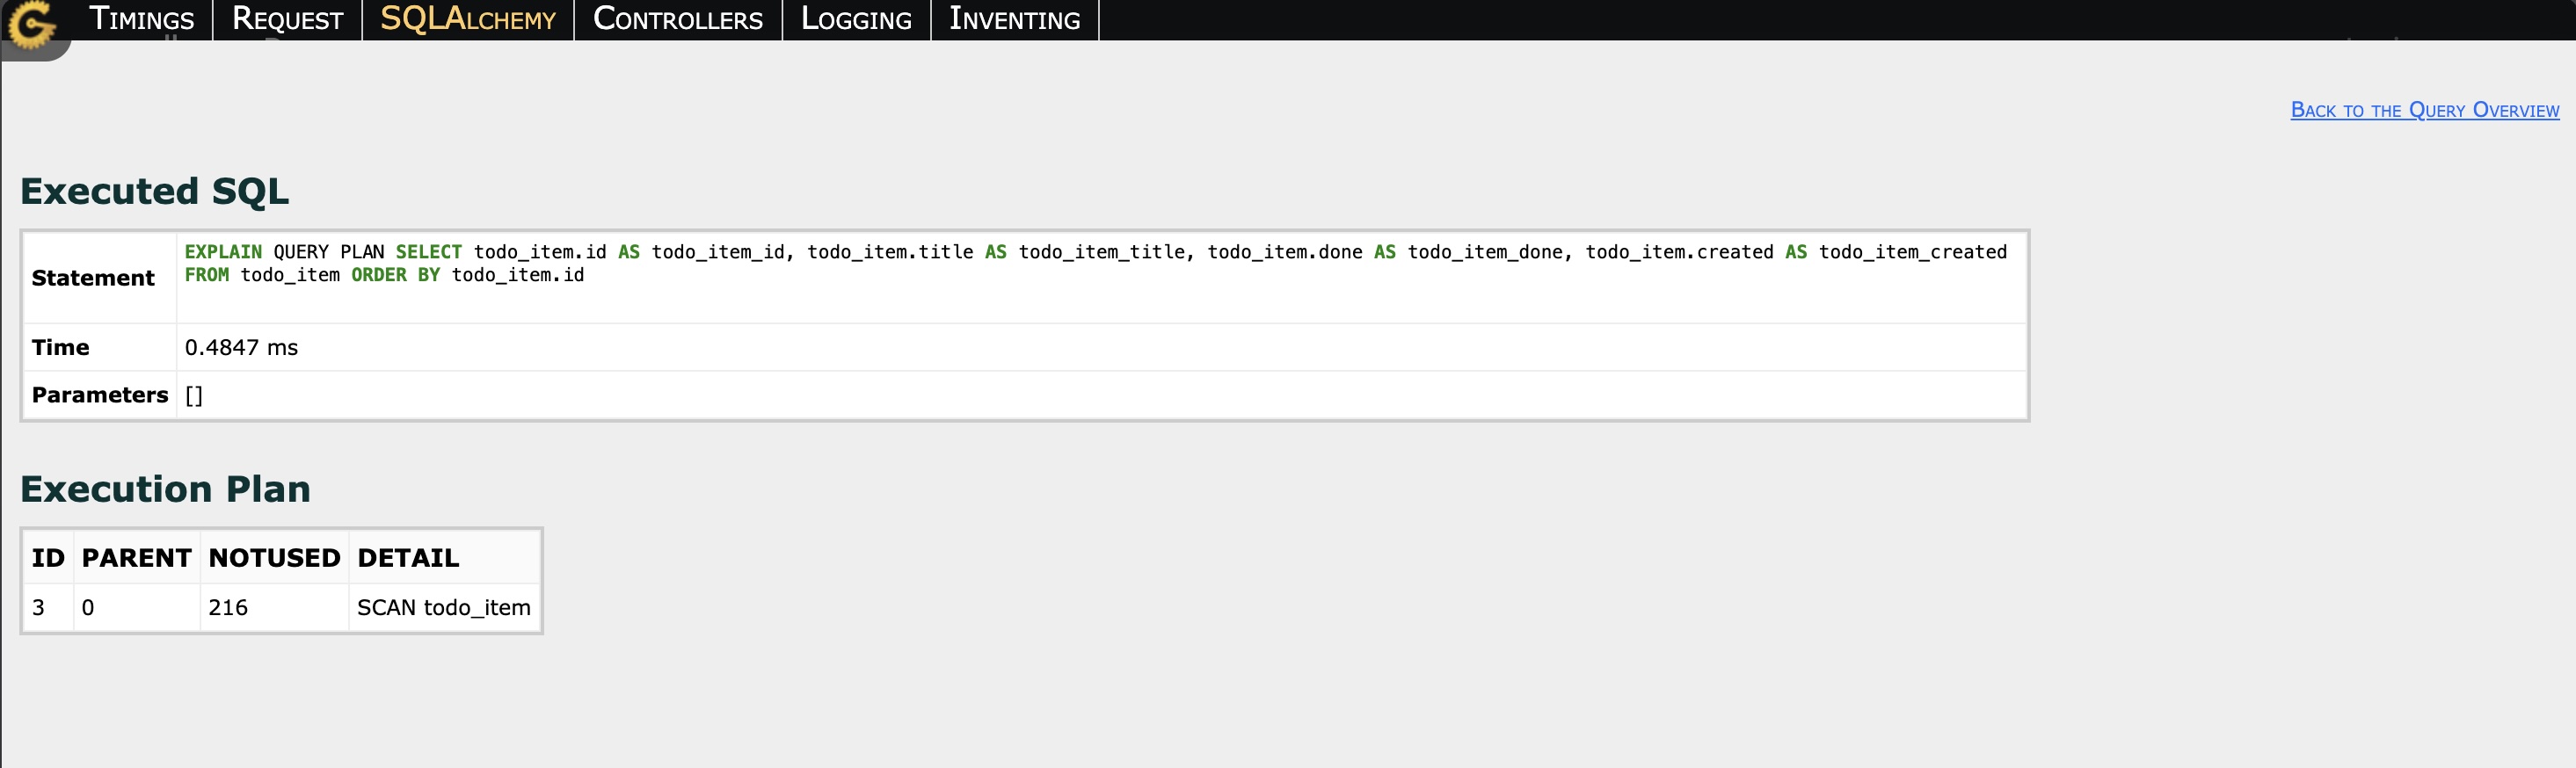
For PostgreSQL databases, you can also view the execution plan for each query by clicking on it, which helps optimize complex queries.
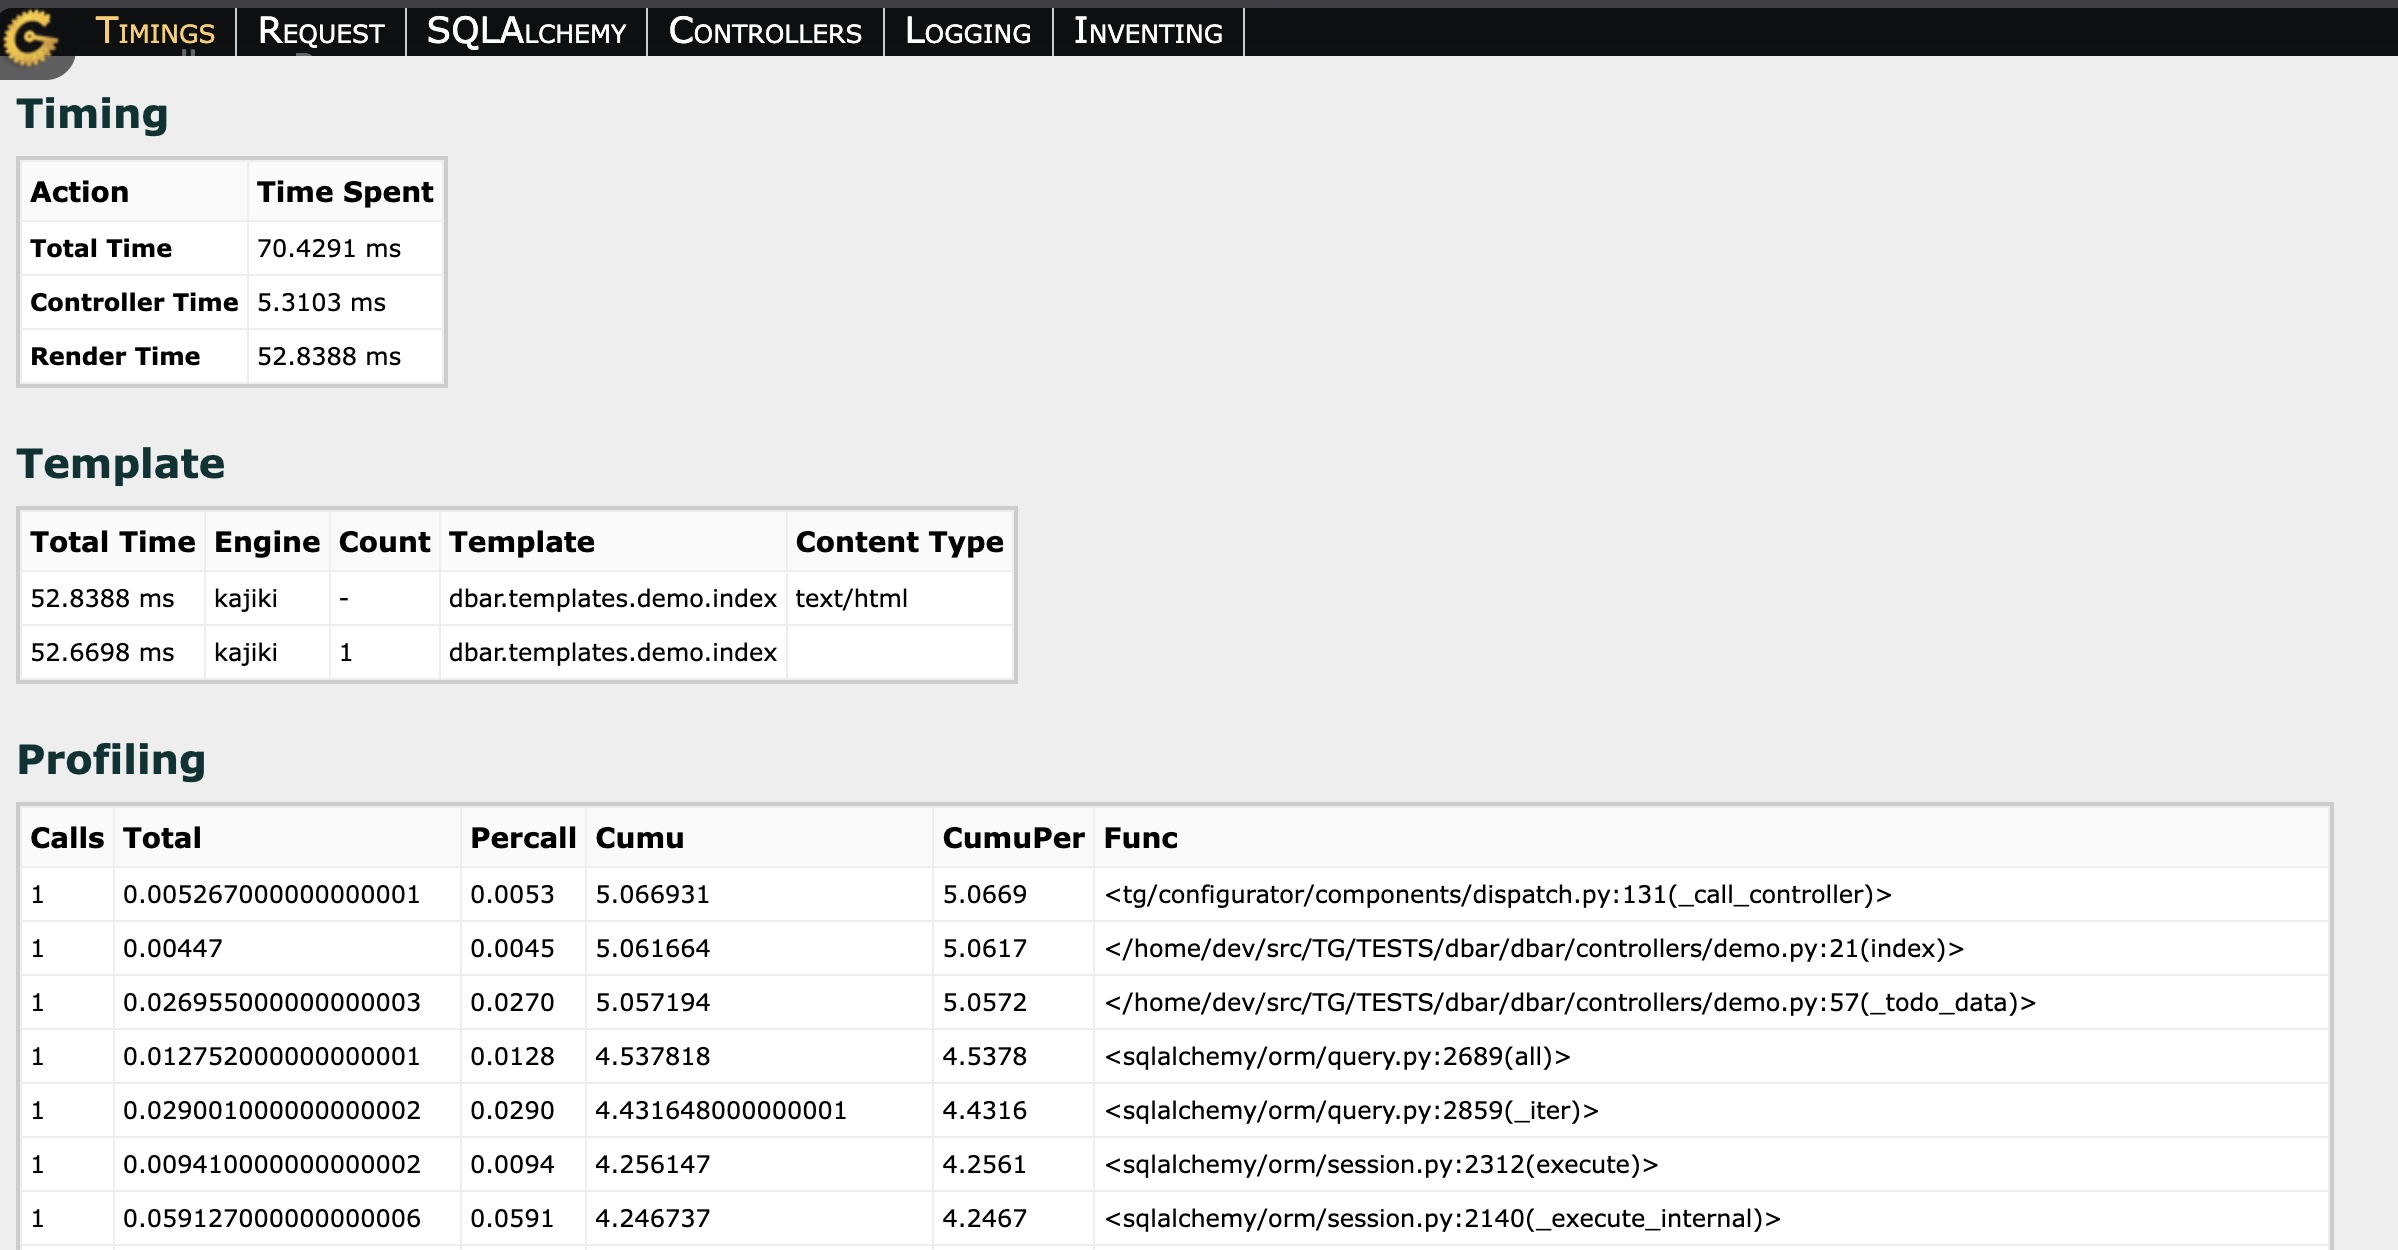
Request Profiling
The profiling tab provides detailed timing information for the entire request:
Total request time
Time spent in each controller method
Time spent in templates
Time spent in SQL queries
Stack trace with timing for each function call
This allows you to quickly identify which parts of your application are taking the most time to execute.
Using Profiling for Performance Optimization
To optimize your application performance using the debugbar:
Identify slow requests: Look for requests with high total execution times
Check SQL queries: Look for queries taking more than 100ms or queries executed multiple times for similar data (N+1 problem)
Analyze the call stack: Identify which controller methods or template rendering is taking the most time
Review execution plans: For slow SQL queries, check if they’re using proper indexes or if the query plan is suboptimal
Common Performance Issues Found with Profiling
- N+1 Query Problem
The debugbar SQL tab will show many similar queries being executed in a loop. Solution: Use SQLAlchemy’s
joinedloadorsubqueryloadto eager load relationships.- Slow Template Rendering
If template rendering is taking significant time, check for complex logic in templates or large data sets being iterated. Solution: Move complex logic to controllers or use caching.
- Missing Indexes
The execution plan view can reveal full table scans on large tables. Solution: Add appropriate indexes to your database tables.
- Expensive Controller Logic
The profiling stack trace shows which methods are taking the most time. Solution: Optimize the algorithm, add caching, or move to background tasks.
Production Considerations
The debugbar is designed for development use only and should not be enabled in production environments as it:
Adds overhead to every request
Exposes sensitive information about your application
Can impact performance significantly
For production profiling, consider:
Using dedicated profiling tools like cProfile
Enabling profiling temporarily on staging environments
Using monitoring tools like New Relic or Datadog
Reviewing application logs for slow requests
Best Practices
Profile early and often: Check the debugbar regularly during development
Test with realistic data: N+1 problems often only appear with larger datasets
Profile the critical path: Focus on the most frequently used pages and the most important user flows
Set performance budgets: Decide on acceptable response times and investigate anything exceeding them
Profile after changes: Always check performance after adding new features or making significant changes